NIFTY

Trend Following Long-Short Positional Strategy on NIFTY Futures

So here it is, a lot of followers of the blog had been requesting me to come up with a trend following Long-Short Positional strategy, which could either be traded in isolation or as a compliment to a Long only Equity Portfolio.

For sometime now, I too was looking at strategies on a larger time frame, I decided to work on something that could be easy to execute, with minimal oversight and could offer a decent risk adjusted return.

Here are the results and the trades taken by the strategy, you can bookmark the page as it’s going to be updated as and when I take trades on the system.

Click here for the Updated Google Sheet

Later in another post I will explain various hedging strategies, i.e. if you would like to trade this strategy in isolation.

With an impending recession, I do expect VIX and Volatility to be on the higher side, the strategy has been designed to benefit from it.

I am afraid I cannot reveal the exact mechanics of the strategy, but its no rocket science. The data of the trades is out there for you to see and its very easy for you to re-engineer it with some effort.

Note - I am not a SEBI Registered Advisor and this is not a recommendation to trade.

Discretion to Automation | My Journey So Far | NIFTY OD Strategy

Writing this post to document my challenges as I am trying to automate my trading strategies. As shared in the previous post, I am working on Automating some of my trading strategies, but I am also realizing how difficult it is to convert what was once a Hybrid trading strategy (Quant informed but Discretionary) to a fully Quantitative and Automated strategy.

The Good

  1. Given almost a decade long screen time, it really helps you come up with hypothesis-es which form the basis for your trades and rules.

  2. So in a way, as they say in the world of Optimization, you can define your “Optimization Space” better.

  3. Automation efforts can have a fairly non linear pay off, your effort is towards a strategy, which is sort of fixed, but can be deployed for multiple people and allocation sizes (regulation permitting).

  4. You get more time to focus on Strategy Design than on Execution.

The Bad

  1. Its not easy to deal with itchy fingers, reminds me of the Ulysses and the Sirens story , I need someone to tie my hands for now. You invariable want to ‘finger’ the trade.

  2. Its impossible to factor in that “hunch”, where you square off saying - I don’t think this is going anywhere.

  3. Lower Returns - Yes, its quite possible that the returns from the same strategy may reduce due to its inability to factor in all the variables which you as a human would. I am not sure about this, will update as and when I get to know.

The Ugly

  1. Thankfully no Ugly situations so far. Lets see. Fingers Crossed.

Which Strategy is being Automated?

I am testing my Bread and Butter Strategy that I call NIFTY - OD this strategy tries to capture a part of the Opening Range of NIFTY Futures. At the moment this is being implemented and tested on Futures, later will move it to Options for better cost efficiency.

Opening Spike | NIFTY Weekly OTM Strike Based Strategy | Performance

Those of you in the trading room would already know the changes that we have made to the existing Opening Spike trade by using OTMs instead of ITMs.

The Thesis - This strategy is about capturing the opening volatility, its a direction agnostic strategy and we aim to capture statistically optimal moves, with a fixed target and risk. We use NIFTY Weekly OTM Strikes to execute this strategy.

Here is the performance of the approach for the current month (As executed live in the Trading Room)

So what’s so great about it?

Well, several things.

  1. Low Capital Requirement - Typically the OTM Premiums that we use are in the range of Rs. 20 to 25. We keep 4x of which as the allocated capital for this strategy.

  2. Low Transaction Costs - Low premiums has a direct impact on STT and as you can see the strategy itself is designed to take very few trades. So on all counts low costs. *Example of a contract note below to give you a sense.

  3. High Win Rate - Yes this approach has a very high win rate, we have statistically tested it.

So whats the catch?

Like all good things in life, this one comes with a few catches,

  1. Time Dependent - This trade occurs at a specific time window, you need to be there to capture it.

  2. Execution Skills - Yes, this one is the most challenging one, being a scalper its easy for me to execute this, but if you are new there could be a learning curve of close to a month at least to get this right.

* Contract Note Example / Broker SAS Online

Warning!

  • Don’t attempt this by yourself. Unless you know what you are doing.

  • It looks simple but its not easy.

  • We factor in several variables to take this trade, its not a Price only thing.

  • Past performance is no guarantee of future results!

Educational Explainers - Lead Lag Effect - NIFTY

Last week we looked at what Indexes are (Over here).

This week we are investigating the lead-lag relationship between Spot price and Future prices in NIFTY.

So what does academic research and years of observing the market tell us? The verdict is out..

What moves the Index? - The concept of 'Information Flow' and how it works in ^NIFTY50

whatindex.PNG

We’ve all wondered at some point or the other as to what moves the Index? 

And if you are an avid Fintwit follower, you would also have heard people saying “The futures are at a discount, looks like market will fall” or “I see some big orders being punched in NIFTY FUTs, the index is going to rocket”, and other similar things.

In this post, Let’s try to deconstruct how an index moves from one point to another.

So let’s start with the basics

What is an Index? - An Index is a collection of Stocks, the prices of which are weighted and together they arrive at an aggregate value. The weightage in case of ^NIFTY50 Index is based on the market cap of the constituent stocks. If you want to learn more about the constituent stocks and their weight-age, this is the place.

So how do we trade or speculate on an Index? - There are two broad ways to speculate on an Index, and that’s is either through Index Futures or Index Options. For Investors though the choices are ETFs and Index Mutual Funds.

For the context of this post we will stick with Index Futures. In our case that would be NIFTY FUT.

What makes the Index move up or down? - Say the average change in the value of an index is 30 points, why does it move so much?

Average change here means the average of the Open-Close value of the index.

For example if the index opened at 11050 today and closed at 12000 we had a change of +50 points. So if we average this value over say 20 trading days, we may arrive at a value something close to 30. So what’s making this move happen?

It moves because the prices of the constituent stocks change. Say for instance if the top 5 stocks, by market cap - Reliance, HDFC, HDFC Bank, ITC, Infy etc. move down, the market will move down, and visa versa. However, there could be other factors which can effect the change as well, for example, in very short time frames like under 5 minutes, in certain indexes, its the Futures which leads the change in the Index value.

Time-frame of analysis and how it can make a difference?

Are we looking at reasons as to why index moved since last week? or are we looking at reasons as to why index moved since last minute?

As you can see, if you are looking at change on larger time frames, its always Constituents Stocks leading the change in Index value, however on shorter time frames it could be Futures leading the change in Index value.

What is “Information Flow” and what is its relevance here?

Information flow is about the direction of causality of price discovery in a given market, due to the flow-of-information (news/announcements etc.) If that sounds a bit wonkish - what it means is, its either the traders of the constituents stocks who react to the news flow first or its the Index Futures traders who do. These two types of reactions cause two different types of Information flows across Indexes (Spot) and Futures.

The two types of informational flows

Type - a) (Stocks) Spot to Index Futures : Spot value changes first leading the Futures prices to change

Type - b) Index Futures to (Stocks) Spot : Futures prices change first leading the change in the Spot value

Like everything else, it’s more about which type of information flow is more dominant in a given market. It’s not necessarily binary.

As pointed out in the research paper below, for ^NIFTY50 its Type (a) which is more dominant (Image below from reference #2).

This however is not true for all markets, for instance the S&P 500 works on Type (b) logic.

excerpt.PNG

So if you are a short term / intraday trader in ^NIFTY it may be of more value for you to know that its the Spot that leads the Futures.

And one more thing

How do the quants/researchers know, which of the two moves first - Index Value (Spot) vs. Index Futures? 

There are different statistical ways of measuring the strength and direction of causality, look up “tests of causality” if you are interested, for further reading, look up Judea Pearl’s work.

As an Intraday trader, the next time you think about - Why did the ^NIFTY50 index move? You might ask well ask - Which of the constituent stocks moved ^NIFTY50?


Trivia

The name NIFTY50 actually comes from the US Markets, more here.

Judea Pearl happens to be Daniel Pearl’s father


Behind the ‘veil’ of Price | Indicators that signal market microstructure dynamics | Part 4 of 4

In the first three parts of this series we looked at indicators which give us a sense of the microstructure activity of an instrument. In this last and final part, we will try to put it all in context.

Lets’ start with the first principles, the key to all that we are discussing is to see - if LOB (Limit Order Book)/Microstructure dynamics leads price change? If so, is the lead time ‘tradable’. What I mean here is, if it leads by a fraction of a second, then it’s not easy to trade on that signal, we need a lead time within which we can execute a trade.

Another way of articulating the first principle is - What moves price esp. Index Futures? What is the direction of causality as the academicians would say? Does spot/cash market lead futures or is it the other way round?

The reason it’s important to get a handle on this is, because the tools that one would design or use would need to be completely different.

For instance if the Index Futures lead price discovery, then it makes good sense to use Orderbook/Microstructure information as that would ideally precede the move in price. However, if it’s the spot or the cash market that leads, then you may want to look at indicators that capture the bias within the index constituents.

 If you look at the academic literature that examines lead-lag relationships between index futures and spot, you would find indexes which fall on either ends of the spectrum in terms of their bias, almost all would be bidirectional at some points. It seems the degree of participation from Individual Investors, Domestic Institutional Investors and Foreign Institutional Investors has an effect. I am sure there are many other structural reasons which influence this lead-lag effect.

Evidence for NIFTY suggests a Spot to Futures direction of causality.


Now that we have some sense of the direction of causality, I leave it to you figure out, which indicators (in a shorter time frame) would better predict NIFTY Futures. It’s also worth exploring if this lead time between the Spot and futures market is “tradable”.

NiftyScalper | StatShot - 02 | Volatility Clusters

StatShot 01 - Here

In this post let's look at the time segments within the day when NIFTY is more volatile. If you ask what is the relevance of this? Then perhaps you would need to dig a bit on the Internet to understand the relevance of volatility in the context of day trading, but for those in the know, here are the time segments which offer you the "meat" of the day. 

The idea is, your return on time invested would increase exponentially if you avoid trading in time segments that are not volatile. 

A through F stand for an hour of trading time and G for 15 mins. 9:15 to 15:30

A through F stand for an hour of trading time and G for 15 mins. 9:15 to 15:30

The light blue colour represents moves of 3 points / min; light pink represents 5 points / min; and dark blue represents 10 points / min. 

If you are wondering as to why segment "D" has the maximum number of 10 point moves well, here is some hint.

 All standard disclaimers apply, trade safe!

NIFTY - Scalping Set-up - 02 - Mid-Day Mean Reversion

This is in continuation with the scalping set-ups series. 

The first one being (https://www.niftyscalper.com/blogs/2017/11/8/nifty-scalping-set-ups-01-opening-spikes-opening-drive)

In this post we will look at the next most frequently occurring set-up (Close to 85 % of days). In the previous post we looked at Opening Spikes and Opening Drive, now this setup is the third play of the day.

1. What determines entry?

There are two key factors to consider when entering this trade

a) Range - Its recommended that you enter the trade once we cross the mean high low range for the pre europe open time segment. For instance this week the mean morning range has been 62.88 SD being 11.5.

b) Time Segment - Mean is again 11:52 (Hrs) SD being 44 minutes. So its good to attempt this play post 11:00 pm.  

 2. What is the probable - max favorable excursion - reward?

Since we are targeting the mean or the VWAP, we would need to consider where the low is. Typically it will be 25 to 35 points from the mean, so that is the path length that you are intending to capture. You should also factor in the usual time that it takes for price to traverse that length, which is around 1 hour. Please do note that we publish these figures for reference on a daily basis in the trading room. Have a look at the snapshot below.

3. What is the probable - max adverse excursion - risk? - Now that you know the possible target for your trade you can define the risk the way you prefer. Given the high probability of this setup you can have a fixed 1:2 risk reward and in an even where the stop loss does trigger you can re-enter again once the new low is formed.

4. Trade Management Approach - While a fixed R:R is one way, there are people who scale in and out as well, usually with a hedge on the opposite side. Of course that is a more aggressive way of playing this set-up.

On a closing note, I was surprised that this setup is pretty common in other indexes as well. Do have a quick read of the blog post below.

http://traderfeed.blogspot.in/2006/08/trading-by-mean-reversion.html


NIFTY - Scalping Set-up - 01 - Opening Spikes & Opening Drive

Context - As a Scalper / Day trader, mornings are very important for me. Some of you would have noticed in the room that my position sizing in the morning is at max, the reason for that is simple - The probability of range extension + linear price moves (Opening Drive) is more in the morning than in the afternoon.

Now lets delve into the specifics of a setup. Remember the moment we use the word setup you need to be sure of the following elements before hand

1. What determines entry?

2. What is the probable - max favorable excursion - reward?

3. What is the probable - max adverse excursion - risk?

4. Trade Management Approach? Is it 

a) Fixed Size Buy - Scale Out

b) Fixed Size Buy - Fixed Size Sell - All in / All out

c) Scale in - Scale Out

d) Scale in - Fixed Size Sell/All out

While we would visit each of the above issues by themselves, we will now see how visually how does the opening spikes look like and is it worth trading them? 

Look at the image below, it's a NIFTY slight ITM Strike - These are two days of Opening Spikes

Fig -1 Opening Spikes

Do you see a trading opportunity here? Scalpers typically would do their "Johnny One Lot" as Tom Sosnoff calls it here. Knowing very well that the direction of the spike may or may not be the Opening Drive. If you can afford to loose no harm in warming up with a lot or two here. Typically this Occurs between 9:16 to 9:30 IST

Next comes the main Opening Drive trade which is where we expect around 50 to 60% of the day's range to form. The high of this Opening Spike or the Day High till that time becomes an important reference for a breakout trade for the Opening Drive. Typically this occurs between 9:30 to 11:30 - Read it as 1 hour of up move + 15 mins of consolidation at top / retests of high + 45 mins of Mean reversion. The below pictured represent the above two days and their Opening Drives.

Coming to the specifics of the setup

1. Entry Criteria

You define the candle closing time, for entry, you can define anytime, like close of 9:16 candle? - esp. if you want to trade the Opening Spikes. For Opening Drive its better to wait for 10 to 15 minutes at least. So the entry for Opening Drive would be the high after 15 or 20 minutes, you can define it or take it based on momentum at that time. Whatever approach you choose, understand that this is a breakout trade and its safer to enter a bit higher instead of lower, a bit higher would mean 1 or 2 points on NF.  

Fig2.jpg
Fig3.jpg

Since this is still the open, the probability of a range extending is fairly high. (In this para I am talking from a Options Long perspective, it can be CE or PE)

Also look for any previous day's price levels which can act as support/resistances.The following are the key - Previous Day  High/Low/Close/VWAP - If you are keen you may also want to mark similar levels for the previous week - High/Low/Close/VWAP. (In this paragraph I am referring to NF Nifty Futures)

The reason its important to keep these levels as a reference, is because larger time frame traders would use these levels as references (for Buy or Stop Loss) and that may create a flush/volume spike.  

2. What is the Reward - Max Favorable Excursion?

Now that we have defined the entry criteria, the next thing we would need to know is, what is the best and worst that can happen. Lets start with the best things first. Here I would borrow John Sweeney's concept of MFE (Maximum Favorable Excursion) which mean's if the trade works in our favor what is the max gains that we can expect from it. To understand that let me take you through some back-tests that we have done.

The first / second images tell us - what to expect if the price crosses the day high or day low formed till 9:17  on Nifty Futures?

Price crosses Day High till 09:17 

Price crosses Day High till 09:17 

Since we are direction agnostic, lets see what happens when the price crosses the Day Low till 9:17 

Price crosses Day low till 9:17

Price crosses Day low till 9:17

The above data tells us what is it that we can target, obviously if you are using options as a trading instrument you would need to factor in delta of the strikes which you are trading. Nevertheless, we now how a probabilistic sense of what to expect. 

The above information is relevant more for trading Opening Spikes. In the next update to this post, I will share the MFE for Opening Drive.

When thinking about Opening Drive we need to keep three factors in mind to understand the market structure at that point in time.

1. Define a reference - In our case we will use the mean or ATP or VWAP as a reference.

2. We need to understand the mean excursion from the ATP/VWAP- Look at the chart below. Which gives us an important data point - 

This chart tells us the mean percentage of the intra day range that gets formed before 1:30am . As you can see it says 60%, if for e.g. the intra day mean (high-low) range for the index for a given period of time is 70. 60% of 70 i.e. 42 is what gets formed before 1:30pm. 

3. The next aspect that we need to determine is, how does the 42 points range gets formed (between 9:00am to 1:30am).

In the chart below, what we see is, it takes about 83.4 minutes (apox. 1.5 hrs) from 9:15am to the point of Max excursion (high or low) during the first half .

So we have 3 references to work with, a) We know the mean/ATP/VWAP at a given point of time, b) We know the mean (H-L) range that gets formed in the first half 42/25 ish. c) We know that it happens in about 1.5 hours. Creating probabilistic frameworks like this is the key to scalping, its helps us understand where we are at a given point of time and how the odds of wins stack for or against us. 

Feel free to comment and ask questions in the room. Would be happy to clarify.


Launching NiftyScalper Day Trading Room!

I am happy to let you know that we at NiftyScalper are taking the next step to bring the day trading community in India closer through our slack based NiftyScalper Trading Room.

In the past few months, the number of coaching requests were quite overwhelming, and it was taking too much of my time, on top of it I could focus only on 1 or 2 people at a time.

Also, I realized there were several people who could not afford my coaching offering, based on my interactions with a few people I realized, a Trading Room would be a much better way of bridging this gap.

So this is what I intend to offer in the room (From 6th Nov'17)

1. Live Trade Alerts - Yes its not easy to follow, but the idea is to learn from observing so that in future you don't have to depend on the alerts at all. These alerts also act as references for any questions that you may have. Apart from alerts, I also provide live observations on the developing market structure, which includes aspects like Range, Range expansion levels, Points of invalidation for positions, Mean reversion areas etc. Watching the market and the reading the updates would help budding traders connect the dots. Which over the long run would help traders develop an independent sense of the market.

Do note, that I do not use any proprietary indicators, or exclusive and expensive technologies like order-flow/footprint charts. I would perhaps share my rationale sometime soon on the blog as to why I don't see an edge in it. Nevertheless, whatever indicators and references that I use, are (almost) freely available to everyone.   

2. Discuss Trade Rationale & anything else that wold help you become better at the game - Nothing like collectively discussing set-ups and clarifying by asking questions. I may not always be an expert at everything, the group over time will have several experts with different specializations, which would help you gather the wisdom of the crowds. 

3. Discuss/Share Articles/Books - Learning should never end, and if its does, thats the end. With that perspective, the idea is to share and discuss best of the books and articles in the Day trading space

4. View Daily Performance Logs - They say, what gets measured gets managed, so the idea is to post our daily performance logs so that we know how we are doing. This is more from an indicative purpose. One may not be able to post all scalp trades, but we will post trades which can be predicted well in advance. 

5. Specially curated blog posts and NIFTY data analysis reports only for members (after commercial launch) - There is a lot of effort and investment that goes into data analysis and related strategy formation, which is what would be shared with members. I also have data scientists on retainer contracts who help with testing various set-ups. All such data and reports would be available exclusively to the members.

The larger focus of the room will always be Quant/Statistics based scalping strategies. 

Given that I would be hiring people to manage the room and other associated costs, this would be a paid service, however we would make sure the costs are pretty nominal. Initially till the end of 2017 the room would be run on a beta mode and would be free for you to access.

I am also working on creating a detailed glossary and faqs which would help you and others understand the #scalp-alert messages and other conversations better. 

Look forward to your joining the slack group and would request you to type in a short intro (Location/Trading Exp./Etc.) about yourself in the #Intro channel once you join. 

Please use the link below to join

https://join.slack.com/t/niftyscalper-tr/shared_invite/enQtMjgwODY4ODk2MzM5LTJlMDA0NDQ4N2UxYzY0N2IxMjM0YjNlYmNmNGVhZjliOTc4YzhjZmQ1MDEwM2VkODMyMDhhZjI2Mjc4ZTE3ZTE

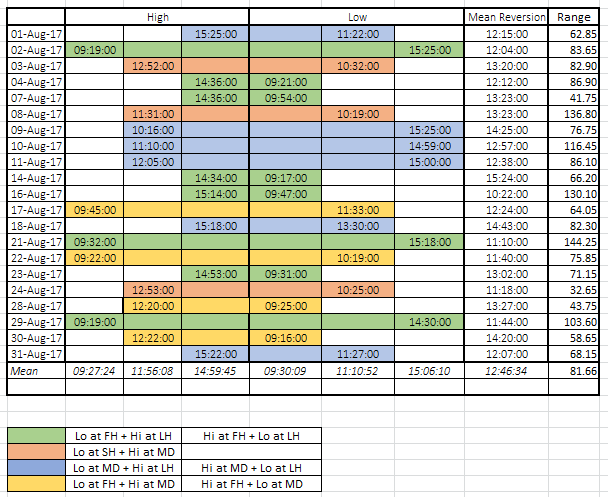
Understanding NIFTY Market Structure | Time of Day

In continuation with the previous article about NIFTY Volatility based on time of day, here is another simple way of understanding the market structure of NIFTY.

Previous article - https://www.niftyscalper.com/blogs/2017/8/8/article-excerpt-niftyscalper-data-analysis-fundamentals-of-short-term-trading-part-two-dr-brett-n-steenbarger

You can create a simple excel sheet to capture the following details, Time stamp for - High, Low, and Mean Reversion of the day. I have categorized time as 1st hour (FH)/last hour (LH) and Mid Day (MD). You will see a pattern here, and over time you may be able to internalize this pattern.

 As an Intraday trader I am direction agnostic here, and as you can see there are only 4 types of days. And yes for the best part, look at the Mean Reversion column, it speaks for itself.

xl.PNG

Combining this with NIFTY Range probabilities should help you improve your ability to make short term forecasts of market direction.


Book Review - High Profit Trading Patterns by Kora Reddy

For a while I have been on the lookout for a book on Indian Indexes. Recently a fellow trader recommended this book and I thought of giving it a read. Thanks to my dyslexia I am not a big reader of books, but given that I didn't have any choice here, I thought of reading it.

Before I share my thoughts on the book here are a few excerpts from the book which resonated with me.

1.jpg

I only wish people understand this fact about indicators. 

2.jpg

As Larry Williams says, patterns form because of the way humans/human emotion reacts to the price, and human reaction of greed and fear does not change. 

3.jpg

I have spent months and months looking at footprint charts to see if it could give me a edge in scalping, and I didn't find any. Took some time to realise that price by itself is good. 

4.jpg

This one is gold according to me, I think this is something I share with all developing traders that work with me.

With the excerpts covered here are my thoughts on the book.

  • This is a first of its kind, in terms of a book which uses NIFTY 10 year historical data to analyze price patterns.
  • Very objective and measured in its approach. 
  • A good primer to understand NIFTY
  • A good start to get ideas about testing NIFTY data and creating your own trading set ups.
  • A must read for anyone trading NIFTY on any time frame.

Here is the Amazon link for you, i.e if you want to buy the book. High Profit Trading Patterns Paperback – by Kora Reddy

Request - For heavens sake don't photocopy this book or buy a pirated version. That's the best way to dis-incentivize more people from writing a book.