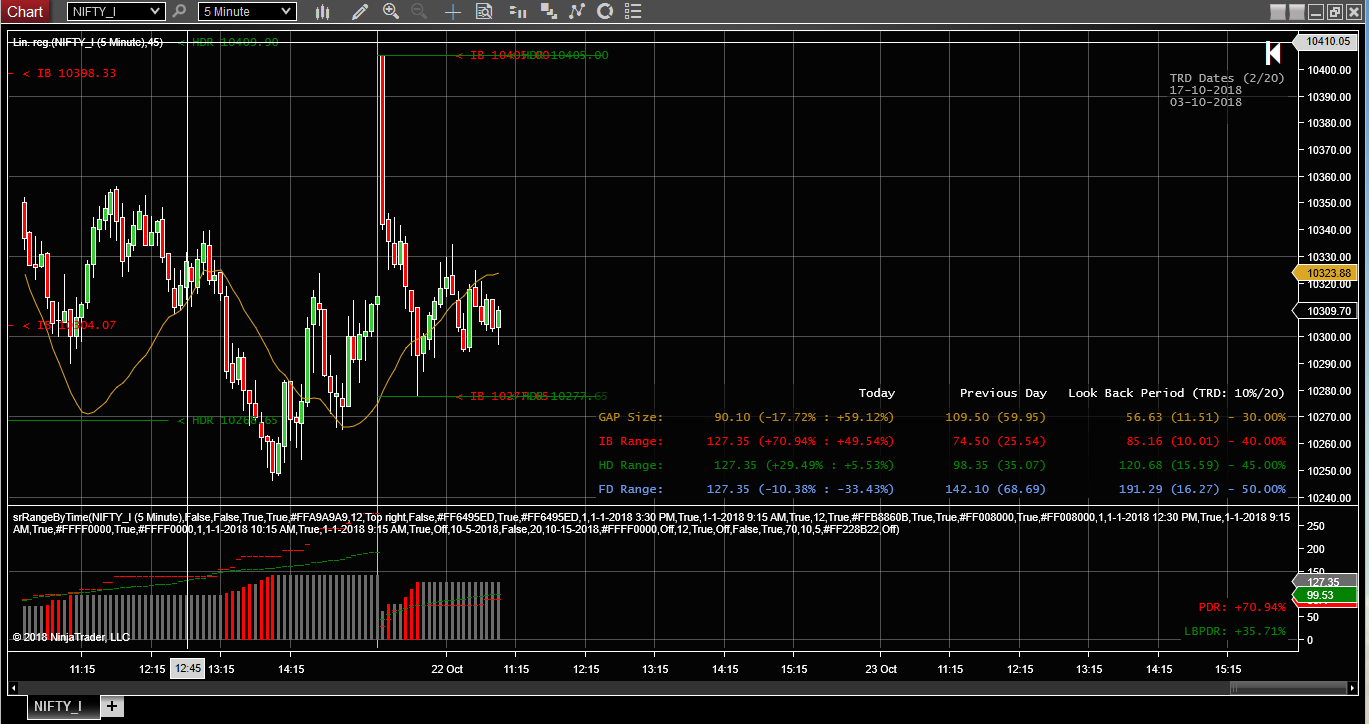
Range By Time - Features & Description
Features
Displays per bar Day High- Day Low range.
Displays Previous day and look back period range for the bar as a hash
Marks Range Extensions based on direction.
Calculates Mean Ranges and Standard Deviations based on a predefined look back period, for Gaps, and 3 user-defined time windows to display as a matrix on the Price pane.
Calculates # of Trend Days based on user-defined parameters within the look-back period.
Line markers for probable range levels for each time segment.
Sound alerts for Range Extensions, Extension of Previous day’s range and Look-back period range
Choice of Mean vs. Median Values for look-back period data.
Special Feature for Back-testing - Choose Dates ranges for which you want to see the mean/median ranges.
Full Screen View
Line markers for Probable ranges based on Look-back period means
Range Stats Display Matrix on Price Panel
Description
This indicator is meant for Futures and Stocks only. Almost all lines/text are customizable. There are primarily three parts to this indicator. First is the cumulative range for each bar, which is displayed in the indicator panel. Second is the Range Stats Matrix which calculates Gap, and Ranges for three predefined time periods. For instance you need the range for 1st hour and then half day and full day, you can set it up based on your market’s open and close hours.
For each of these Ranges you will see, Today’s range, Today’s range as a reference % from previous day and look back period ranges, Previous day range and Standard Deviation, Look back period range and Standard Deviation and % of days from the look back were the mean range was achieved. You also see number of trend days (TD) as a % of total number of days in look-back.
You can use this indicator on multiple machines.
Support & Enhancement
For any issues feel free to write to me on srao@niftyscalper.com - I would try my best to respond in 24 hrs.
If you need any enhancements or additional features. It would typically be billed at a minimum of USD 70 and upwards.
Payment & Refunds
You have two payment options, Instamojo and PayPal. If you choose to pay through Instamojo you will receive the indicator file instantaneously, and with PayPal payments, you will receive the indicator in your mail within 24 hours.
Given that the indicators have open access code, I may not be able to refund your payments.
In INR (Indian Rupees) this indicators would cost you INR 4999 and in USD (US Dollar) $70.


